Tap Water Quality in Hamley Bridge, SA
Postcode 5401 · Supplied by SA Water via Barossa
Quality Score
About Hamley Bridge
Hamley Bridge is a suburb of 709 residents in South Australia (postcode 5401). The median age is 47. It falls within the SA Water area. Neighbouring suburbs include Magdala, Barabba, Alma, Salter Springs.
Most residents own their home with a mortgage (41%), while 33% own outright, while 19% rent. The median household income is $52,416 per year. The top countries of birth for residents are United Kingdom (60%), New Zealand (11%), and Philippines (7%).
Tap water in Hamley Bridge is supplied by SA Water. The suburb receives water via the Barossa supply zone.
Water quality summary
Based on 2025 water quality reports, Hamley Bridge achieves a WaterScore of 8.8 out of 10, rated excellent overall. Water hardness measures 138 mg/L, classified as hard. Residents may notice limescale buildup on appliances and fixtures. The pH level is 0.05, which is outside the ADWG guideline range of 6.5–8.5. The water is fluoridated at 0.6 mg/L, within the recommended range of 0.6–1.1 mg/L for dental health, well under the ADWG maximum of 1.5 mg/L. Chlorine, used for disinfection, measures 0.6 mg/L — well within the ADWG guideline of 5 mg/L. Some residents may notice a slight taste, which can be reduced by refrigerating water or using a carbon filter. Total dissolved solids (TDS) measure 391 mg/L, considered moderate against the ADWG guideline of 600 mg/L. Turbidity is 0.25 NTU, indicating clear water, within the ADWG guideline of 5 NTU. E. coli was not detected in testing, meeting the ADWG standard for microbiological safety.
Census Data
Suburb snapshot
Population
Median Age
Median Income
Owner-occupied
Recommended filters for Hamley Bridge
Products matched to your water profile

iSpring
RCC7AK 6-Stage Under-Sink RO (with Alkaline Re-min)
4.6 · 13,756 ratings on Amazon
Ideal for Hamley Bridge — reduces hardness from 138 mg/L, removes chlorine taste and odour.
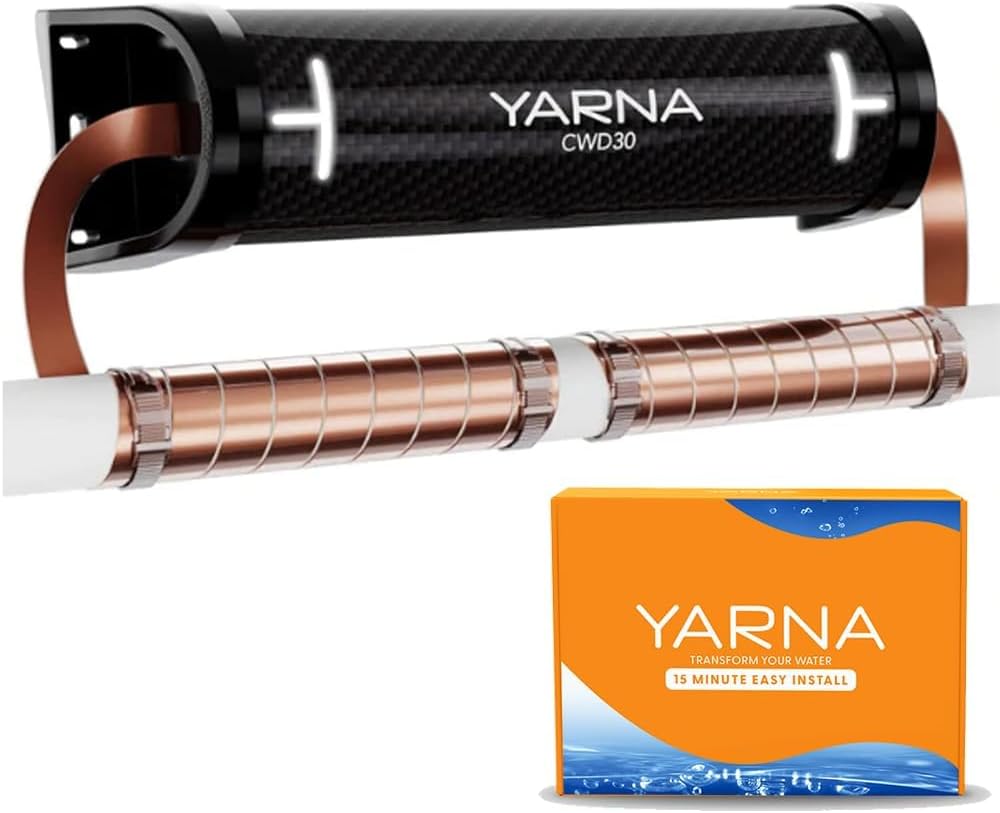
YARNA
Capacitive Electronic Water Descaler (Whole House)
4 · 538 ratings on Amazon
Ideal for Hamley Bridge — helps reduce limescale buildup from hard water (138 mg/L) without removing hardness minerals.

Nakii
Water Filter Pitcher (WQA Certified, 150 Gallons)
4.4 · 6,827 ratings on Amazon
Ideal for Hamley Bridge — removes chlorine taste and odour.
Comparison
How Hamley Bridge compares
Compared to South Australia and national averages
| Metric | Hamley Bridge | SA Avg | National Avg |
|---|---|---|---|
| Hardness | 138 mg/L | 119.3 mg/L | 85.1 mg/L |
| pH | 0.05 | 3.2 | 8.4 |
| Fluoride | 0.6 mg/L | 0.5 mg/L | 0.7 mg/L |
| Chlorine | 0.6 mg/L | — | — |
| Turbidity | 0.25 NTU | 0.1 NTU | 0.4 NTU |
| TDS | 391 mg/L | 341.5 mg/L | 275.7 mg/L |
Full Results
Detailed water quality data
All values compared against Australian Drinking Water Guidelines (ADWG)
| Parameter | Value | Unit | ADWG Guideline | Status |
|---|---|---|---|---|
| Alkalinity | 65 | mg/L | No limit | Measured |
| Aluminium | 0.019 | mg/L | < 0.2 | Good |
| Calcium | 27.9 | mg/L | No limit | Measured |
| Chloride | 127 | mg/L | < 250 | Good |
| Free Chlorine | 0.6 | mg/L | < 5 | Good |
| Total Chlorine | 0.7 | mg/L | < 5 | Good |
| Colour | 1 | HU | < 15 | Good |
| Copper | 0.0157 | mg/L | < 2 | Good |
| E. coli | 0 | cfu/100mL | < 0 | Compliant |
| Fluoride | 0.6 | mg/L | < 1.5 | Good |
| Hardness | 138 | PPM or mg/L | < 200 | Good |
| Iron | 0.0828 | mg/L | < 0.3 | Good |
| Lead | 0.0005 | mg/L | < 0.01 | Good |
| Magnesium | 16.7 | mg/L | No limit | Measured |
| Manganese | 0.0041 | mg/L | < 0.1 | Good |
| Nitrate | 0.18 | mg/L | < 50 | Good |
| pH | 0.05 | µg/L | 6.5 – 8.5 | Outside range |
| Sodium | 73.7 | mg/L | < 180 | Good |
| Sulfate | 59.2 | mg/L | < 500 | Good |
| Total Dissolved Solids | 391 | mg/L | < 600 | Good |
| Turbidity | 0.25 | NTU | < 5 | Good |
Safety
Safety assessment
Of 21 parameters tested, most fall within Australian Drinking Water Guidelines with 1 exception: pH at 0.05 µg/L. E. coli was not detected, meeting the ADWG standard for microbiological safety.
Based on comparison with Australian Drinking Water Guidelines (ADWG)
Explained
What these numbers mean
Hard (138 mg/L)
Water Hardness
Your water is classified as hard. Expect noticeable limescale on heating elements, showerheads, and taps. Soap and shampoo may not lather as freely, requiring more product. Some residents report drier skin or hair. Periodic descaling of kettles and hot water systems is recommended to maintain efficiency.
Outside Range
pH Level
pH of 0.05 is outside the ideal range of 6.5–8.5. The ADWG recommends pH between 6.5 and 8.5 for drinking water.
Fluoridated
Fluoride
Fluoride at 0.6 mg/L. Within the recommended 0.6–1.1 mg/L range for dental health.
Chlorine
Disinfection
Chlorine measured at 0.6 mg/L, well within the ADWG guideline of 5 mg/L. Used for disinfection to keep water safe. May affect taste slightly — refrigerating water or using a carbon filter can help.
Learn more about these measurements in our water quality glossary — including Hardness , pH , Fluoride , and ADWG guidelines .
Advice
Practical tips for residents
Chlorine Levels Are Low
Chlorine in Hamley Bridge measures 0.6 mg/L, which is low. Filling a jug and letting it stand for 30 minutes will reduce any residual taste.
Watch for Limescale
Hamley Bridge has hard water at 138 mg/L. Wipe taps and showerheads periodically with vinegar to prevent limescale buildup on fixtures.
Fluoride in Your Water
Fluoride measures 0.6 mg/L in Hamley Bridge. Australian guidelines allow up to 1.5 mg/L. This is added by utilities to support dental health in the community.
Consider a Filter for TDS
Total dissolved solids measure 391 mg/L. A reverse osmosis filter can reduce dissolved minerals if you prefer a cleaner taste in drinking water.
Slightly Acidic Water
pH measures 0.05 in Hamley Bridge, which is slightly acidic. Running the tap for 30 seconds before drinking can flush any metals that dissolve more readily in acidic water.
Get water quality alerts
We'll email you when Hamley Bridge's water data is updated.
FAQ
Frequently asked questions
Is tap water safe to drink in Hamley Bridge?
How hard is the water in Hamley Bridge?
What water utility supplies Hamley Bridge?
Does Hamley Bridge water have fluoride?
What is the water quality score for Hamley Bridge?
What is the population of Hamley Bridge?
Supplier
Water utility
- Utility
- SA Water
- Supply Zone
- Barossa
- Data Source
- SA Water — water quality performance results november 2025
Nearby
Nearby suburbs
Same water utility, similar water quality
Similar Quality
Suburbs with similar water quality
Suburbs scoring between 7.8 and 9.8
Utility reports average the grid — not your home
Hamley Bridge's water meets ADWG standards at the source, but old pipes, roof tanks, and ageing plumbing can add lead, copper or bacteria before the water reaches your tap. These won't show up in your utility report.
Check your own tap before buying a filter or assuming the suburb average matches your home.

Tetra
EasyStrips 6-in-1 Water Test (100 strips)
4.6 · 8,650 ratings on Amazon
Tests 6 parameters in 60 seconds: hardness, chlorine, pH, nitrate, nitrite, alkalinity. Cheapest way to verify your utility data.
Test my tap →Sponsored Amazon link. Check Amazon for current price and availability.

Heavy Metals
Drinking Water Test Kit (Lead, Copper, Iron, Mercury)
4.2 · 250 ratings on Amazon
20 tests. Detects lead, copper, iron, mercury — the things utility reports miss. Mobile-app results, EPA-standard thresholds.
Check metals kit →Sponsored Amazon link. Check Amazon for current price and availability.
Guides for Adelaide and SA
In-depth articles on the water supply that serves Hamley Bridge
Related
Explore more
Related pages for Hamley Bridge, SA
Is tap water safe?
Safety assessment
Water hardness
138 mg/L
Best water filter
Filter recommendations
South Australia water quality
State coverage
SA Water
Water utility
Compare with Magdala
Hamley Bridge vs Magdala
Compare with Barabba
Hamley Bridge vs Barabba
Compare with Alma
Hamley Bridge vs Alma
Disclaimer: The information on this page is for general informational purposes only and does not constitute medical advice, health recommendations, or professional guidance. Water quality data is sourced from SA Water (2025 report) and reflects conditions at the time of utility testing — it may not reflect real-time water quality at your tap. Actual water quality can vary due to local plumbing, seasonal changes, and distance from the treatment plant. For specific health concerns, consult a qualified health professional. For the most current water quality information, contact your local water utility directly. See our Terms of Use.