Money Can't Buy Better Tap Water: Rich vs Poor Suburbs
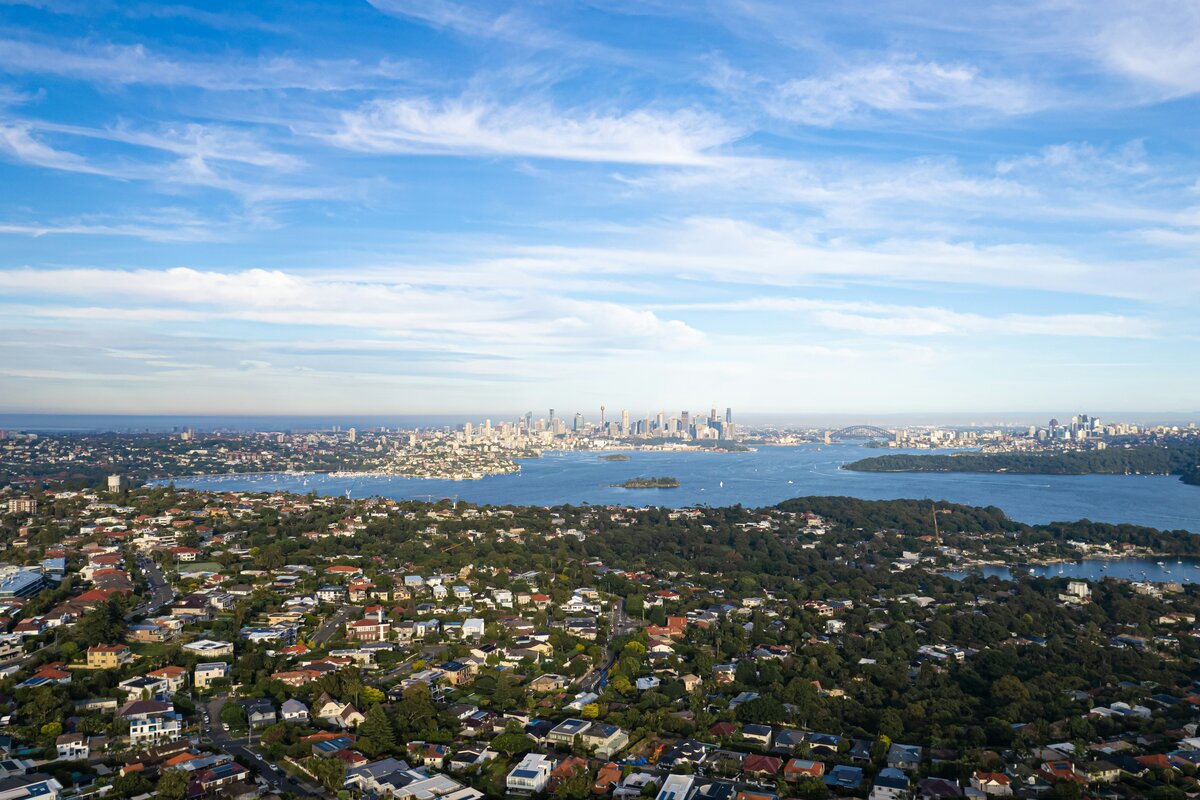
Point Piper, on Sydney Harbour, is one of the highest-income suburbs in Australia. At the 2021 Census its median household earned $4,530 a week. Its tap water scores 9.5 out of 10 on WaterScore. So does the water in Miller, in Sydney’s south-west, where the median household earned $825.
That pairing is not a fluke. We compared rich vs poor suburbs across Australia, matching each suburb’s household income from the census with its WaterScore, which rates the latest results published by its water utility against the Australian Drinking Water Guidelines. Across 2,217 suburbs, the richest fifth averaged 9.47 and the poorest fifth 9.44. Money does not buy better tap water in Australia. Your supply zone decides it.
How We Compared Rich and Poor Suburbs
Income. We used each suburb’s median weekly household income from the ABS 2021 Census, the most recent census with suburb-level results [1].
Water. We used each suburb’s WaterScore, a 0 to 10 rating of the latest test results published by its water utility, compared with the ADWG. Our methodology explains how the score is built.
Which suburbs. We kept every scored suburb with at least 2,000 residents, so that tiny localities with unusual incomes do not skew the results. That gave 2,217 suburbs, after we left out Perth’s metropolitan area (289 suburbs). Our data holds one hardness figure for the whole Perth supply, so it cannot tell Peppermint Grove from Perth’s outer suburbs. Our Perth hardness guide has the locality figures.
We then split the suburbs into five equal groups by income, from the richest fifth to the poorest.
The Result: The Same Water at Every Income
| Income group | Median weekly household income | Suburbs | Average WaterScore | Scoring 9.5 or more | Median hardness (mg/L) |
|---|---|---|---|---|---|
| Richest fifth | $2,365 to $4,894 | 443 | 9.47 | 78% | 49 |
| Second fifth | $2,045 to $2,364 | 443 | 9.44 | 65% | 48 |
| Middle fifth | $1,747 to $2,045 | 444 | 9.42 | 63% | 49 |
| Fourth fifth | $1,426 to $1,747 | 443 | 9.45 | 73% | 51 |
| Poorest fifth | $755 to $1,426 | 444 | 9.44 | 75% | 52 |
The richest and poorest fifths are 0.03 points apart. The middle-income suburbs score slightly lower than both, which suggests the small differences come from geography rather than wealth. The richest tenth of suburbs averaged 9.47 and the poorest tenth 9.44.
Statistically, income and WaterScore are unrelated. The rank correlation between them is -0.03, where 0 means no link at all and 1 or -1 would mean a perfect one.
City by City: Rich vs Poor Suburbs
The national figures mix cities with different water. The real test is within each city, where the richest and poorest suburbs draw from the same utility.
| City | Suburbs compared | Richest fifth average | Poorest fifth average | Lowest to highest score |
|---|---|---|---|---|
| Sydney (Sydney Water area) | 632 | 9.50 | 9.54 | 9.5 to 9.7 |
| Melbourne | 387 | 9.45 | 9.44 | 9.0 to 9.7 |
| Brisbane | 254 | 9.24 | 9.30 | 9.2 to 9.5 |
| Adelaide | 248 | 9.52 | 9.51 | 8.6 to 9.6 |
| Canberra | 96 | 9.70 | 9.70 | 9.7 to 9.7 |
| Hobart | 39 | 9.30 | 9.64 | 9.1 to 9.8 |
Sydney. Every one of the 632 suburbs in Sydney Water’s area scores between 9.5 and 9.7, from the Illawarra to the Blue Mountains. The five highest-income suburbs in our sample, Longueville, Riverview, Balgowlah Heights, Castlecrag and North Balgowlah, all score 9.5. So do Bidwill, Cartwright and Miller at the other end. Windang and Warrawong in the Illawarra, two of the lowest-income suburbs in the area, score a little higher at 9.6.
Melbourne. The richest and poorest fifths are 0.01 points apart, and both have soft water, with median hardness of 19 and 18 mg/L. Plenty, where households earn a median $3,190 a week, and Dallas, at $1,088, both score 9.6. Toorak scores 9.4.
Brisbane. The richest fifth scores slightly lower here. Pullenvale, Fig Tree Pocket, Brookfield and Kalinga are all in Seqwater’s Brisbane supply zone, where water carries about 115 mg/L of hardness, and score 9.2. Inala, one of the city’s lowest-income suburbs, is in the same zone with the same water and the same 9.2. Meanwhile Redcliffe, Margate and Woody Point on the Redcliffe Peninsula, in the Moreton zone at 53 mg/L, score 9.5, and lower-income Logan suburbs such as Woodridge and Logan Central, in the Logan zone at 85 mg/L, score 9.3. Our Brisbane hardness guide has the figures for each zone.
Adelaide. Millswood ($2,836 a week) and Malvern score 9.6. The Elizabeth suburbs in the north, with household incomes under $900 a week, score 9.5. They are in SA Water’s northern metro zone, where hardness is 111 mg/L against 97 mg/L in the central zone.
Canberra. All 96 suburbs score 9.7. Our data has the same Icon Water results for every Canberra suburb, so Red Hill, where households earn $3,938 a week, scores the same as Charnwood at $1,818.
Hobart. This is the one city where the poorest fifth scores clearly higher, and the reason is a supply zone, not money. The zone serving West Hobart, Mount Stuart and Lenah Valley averaged 4.79 total coliforms per 100 mL in TasWater’s latest report, which our scoring treats strictly, so those suburbs score 9.1. Tranmere, the highest-income suburb in Hobart’s sample, is in the Clarence zone across the river and scores 9.8, as do lower-income Warrane and Risdon Vale. Our Hobart tap water guide explains those coliform results.
Same Water, Very Different Incomes
These pairs sit at opposite ends of their city’s income range.
| City | Higher-income suburb | Weekly household income | Score | Lower-income suburb | Weekly household income | Score |
|---|---|---|---|---|---|---|
| Sydney | Longueville | $4,894 | 9.5 | Miller | $825 | 9.5 |
| Melbourne | Plenty | $3,190 | 9.6 | Dallas | $1,088 | 9.6 |
| Brisbane | Fig Tree Pocket | $3,791 | 9.2 | Inala | $998 | 9.2 |
| Adelaide | Millswood | $2,836 | 9.6 | Elizabeth South | $774 | 9.5 |
| Canberra | Red Hill | $3,938 | 9.7 | Charnwood | $1,818 | 9.7 |
You can put any two suburbs side by side with our comparison tool, for example Longueville vs Miller.
Why Money Doesn’t Change Your Tap Water
Water utilities supply cities in zones. Each zone is fed from the same dams or bores, through the same treatment plants and reservoirs, so the houses in it get the same water whatever they are worth. Zone boundaries follow pipes and hills, not property prices.
The differences you can measure come from the source. Adelaide’s water is harder than Melbourne’s because of where it comes from, which is why our national rankings show bigger gaps between cities than within them. Our best and worst suburbs ranking found the same pattern: the top scores are in Tasmania and the lowest in regional South Australia’s groundwater towns, not in particular income brackets.
Every one of these suburbs is held to the same Australian Drinking Water Guidelines. enHealth, the national environmental health committee, puts it plainly: town drinking water supplied to homes in Australia is known to be safe [2].
Where Money Can Make a Difference: Inside the House
The pipes and taps inside a home are a different matter, and the building’s age and fittings count for more there than its suburb.
enHealth says lead can dissolve into drinking water from some brass plumbing fittings, especially when water sits in them for a long time, and that some older homes still have copper pipes joined with lead-based solder [2]. Its advice for every household:
- Use water from the cold tap for drinking and cooking.
- Run cold taps used for drinking and cooking for at least 10 seconds first thing in the morning.
- Run them for at least 2 minutes after more than 48 hours without use, such as coming home from holidays.
When renovating, enHealth recommends plumbing products certified to WaterMark and the drinking water contact standard AS/NZS 4020, and low-lead or lead-free fittings [2]. A filter is the other thing money can buy. It changes taste, not safety, and our best water filter guide covers which types suit which city.
What You Can Do
- Look up your suburb. Every WaterScore suburb page shows the latest results for your supply zone, for example Fig Tree Pocket or Miller.
- Compare two suburbs before you buy or rent, using our comparison tool.
- Flush the cold tap for 10 seconds each morning, as enHealth advises, especially in an older home.
- If the taste bothers you, a carbon filter fixes chlorine taste and a reverse osmosis unit reduces hardness. Our benchtop and under-sink guides list certified options.
Frequently Asked Questions
Do richer suburbs have better tap water in Australia?
No. We compared 2,217 suburbs using ABS 2021 Census household income and WaterScore’s ratings of utility test results. The richest fifth averaged 9.47 out of 10 and the poorest fifth 9.44, and income explained almost none of the difference between suburbs. Within each city, rich and poor suburbs on the same supply zone get the same water.
Which Australian suburbs have the best tap water?
On WaterScore’s data, 105 suburbs share the top score of 9.8, and 102 of them are in Tasmania, mostly on Hobart’s eastern shore. Every Canberra suburb scores 9.7. Our national rankings list the highest and lowest scoring suburbs and the state averages.
Does where you live in a city change your tap water?
Only through your supply zone. In Brisbane, suburbs in Seqwater’s Brisbane zone get water with about 115 mg/L of hardness, while the Redcliffe Peninsula in the Moreton zone gets about 53 mg/L. Rich and poor suburbs sit on both sides of that line. In Canberra every suburb has the same results, so every suburb scores the same.
Is tap water in lower-income suburbs safe to drink?
Yes. Every suburb on a town supply gets water treated and monitored against the same Australian Drinking Water Guidelines, whatever its income. enHealth, the national environmental health committee, says town drinking water supplied to homes in Australia is known to be safe.
Why do Hobart’s western suburbs score lower than the eastern shore?
Because of one supply zone’s test results, not income. The zone serving West Hobart, Mount Stuart and Lenah Valley averaged 4.79 total coliforms per 100 mL in TasWater’s latest report, which our scoring counts strictly. The Clarence zone on the eastern shore recorded 1, so suburbs there score 9.8.
Summary
Rich vs poor suburbs in Australia get the same tap water. Across 2,217 suburbs the richest fifth averaged 9.47 out of 10 and the poorest 9.44, and within cities like Canberra and Sydney the scores barely move at all. What sets your water is the supply zone your street sits in, and what you can change is inside your own walls: the taps, the pipes and whether you run the cold tap in the morning.
Sources
- 2021 Census QuickStats — Australian Bureau of Statistics, median weekly household income by suburb (for example Point Piper, Miller and Longueville)
- enHealth guidance statement: Lead in drinking water from some plumbing products — Environmental Health Standing Committee (enHealth)
- Australian Drinking Water Guidelines — NHMRC
- How WaterScore calculates its ratings — WaterScore methodology and data sources
- Best and worst water quality suburbs in Australia — WaterScore national rankings
Recommended filters for this topic
Hand-picked Amazon products relevant to this article.

Philips
Water Filter Jug 3.4L (X-Clean)
3.5 · 6 ratings on Amazon
Budget pick — ideal for chlorine, taste, and general soft-water areas.

Waterdrop
TSA Under-Sink Carbon Filter (Chlorine + Taste)
4.4 · 2,237 ratings on Amazon
Under-sink carbon filter for chlorine taste and odour.

Waterdrop
WD-C1H Countertop RO (Hot & Ambient)
4.4 · 32 ratings on Amazon
Top pick for hard-water cities — removes 90%+ of dissolved minerals.

Berkey
Travel Water Filter (2× Black Elements)
4.5 · 3,034 ratings on Amazon
Gravity-fed — no plumbing, great for renters and travel.
Disclaimer: This article is for general informational purposes only and does not constitute medical advice, health recommendations, or professional guidance of any kind. Data referenced may not reflect current water conditions. For specific concerns about your drinking water, consult your local water utility, a licensed water testing laboratory, or a health professional. See our Terms of Use.
Cite
Cite this page
Free to quote and reuse with a credit to WaterScore and a link to this page. Journalists and researchers can find key figures and contacts on our press and data page.
WaterScore. (2026, October 24). Money Can't Buy Better Tap Water: Rich vs Poor Suburbs. https://waterscore.com.au/articles/rich-vs-poor-suburbs-tap-water-australia/
Written by

Water Infrastructure Analyst
Civil engineer and former SA Water/Melbourne Water analyst specialising in comparative water quality.
Reviewed by

Lead Water Quality Analyst
Environmental scientist and water quality researcher with a PhD from the University of Melbourne.
What You Can Do
Check the water quality in your area and find the right filter for your needs.
Sponsored Amazon link. Check Amazon for current price and availability.
Related Articles
Best and Worst Water Quality Suburbs in Australia (2026)
Best water quality suburbs in Australia, ranked on measured data from 8,400 suburbs. See the highest and lowest scorers, state averages and your suburb.
Australia's Hardest Water Suburbs: Where Limescale Wins
Hardest water suburbs in Australia ranked with actual mg/L readings. See the 20 suburbs exceeding ADWG guidelines and what limescale means for your home.
Brisbane vs Melbourne Water Hardness Compared
Brisbane's water is over 4x harder than Melbourne's at 81 mg/L vs 18 mg/L. See zone-by-zone data, practical impacts and filter advice for both cities.