Water Hardness in Perth: Suburb-by-Suburb Data
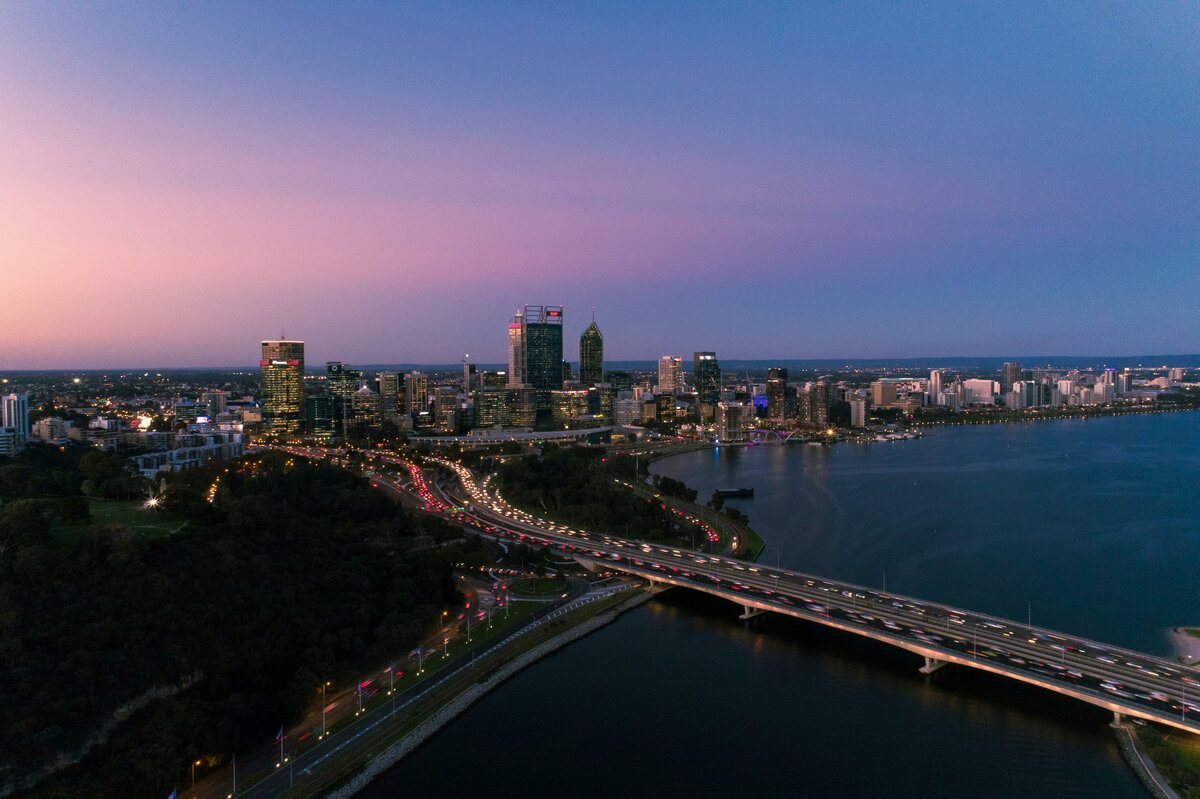
Perth has the widest range of water hardness of any Australian capital. In Dwellingup, it measures 29 mg/L. In Two Rocks, 228 mg/L. That’s a 199 mg/L spread within a single city’s supply network, and it means your experience with Perth tap water depends almost entirely on which suburb you live in.
The city-wide average of 96 mg/L places Perth in the “moderately hard” category, but that number hides enormous variation. Two localities exceed the ADWG aesthetic guideline of 200 mg/L. Seven sit below 60 mg/L and qualify as soft. We’ve mapped Water Corporation’s 2023-24 data across all 28 supply localities so you can see exactly where your suburb falls.
What Is Water Hardness?
Water hardness measures the concentration of dissolved calcium and magnesium minerals, expressed as mg/L of calcium carbonate (CaCO3). These minerals dissolve into water as it flows through rock and soil before reaching a treatment plant.
The standard classification used in Australia:
| Classification | Hardness (mg/L CaCO3) |
|---|---|
| Soft | 0 – 60 |
| Moderately hard | 61 – 120 |
| Hard | 121 – 180 |
| Very hard | 181+ |
The ADWG sets 200 mg/L as an aesthetic guideline. This isn’t a health limit. Hard water is safe to drink at any level found in Australia. But above 100 mg/L, you’ll notice white scale on kettles, reduced soap lathering, and spotting on glass and fixtures.
For a deeper look at how these classifications play out in daily life, see our hard water vs soft water guide.
Perth Water Hardness by Locality
Water Corporation supplies Perth through a mix of groundwater (45%), desalination (36%), and surface water (19%). The city is divided into 28 supply localities, each receiving a different blend of these sources. That blend determines your water’s hardness.
Here’s the complete 2023-24 data for all Perth localities, sorted from hardest to softest:
| Locality | Hardness (mg/L) | TDS (mg/L) | pH | Sodium (mg/L) | Classification |
|---|---|---|---|---|---|
| Two Rocks | 228 | 535 | 7.59 | 57 | Very hard |
| Yanchep | 204 | 576 | 7.64 | 82 | Very hard |
| Neerabup | 190 | 584 | 7.60 | 93 | Very hard |
| Lexia | 145 | 465 | 7.70 | 73 | Hard |
| Mirrabooka | 128 | 495 | 7.04 | 109 | Hard |
| Wanneroo | 124 | 479 | 7.43 | 92 | Hard |
| Whitfords | 120 | 468 | 7.71 | 93 | Moderately hard |
| West Yokine | 114 | 531 | 7.53 | 116 | Moderately hard |
| Mt Hawthorn | 110 | 564 | 7.90 | 126 | Moderately hard |
| Mt Yokine | 103 | 560 | 7.88 | 130 | Moderately hard |
| Mundaring | 98 | 467 | 8.44 | 113 | Moderately hard |
| South Perth/Kewdale | 97 | 542 | 7.80 | 125 | Moderately hard |
| Greenmount | 95 | 488 | 8.13 | 113 | Moderately hard |
| Foothills | 86 | 430 | 7.89 | 107 | Moderately hard |
| Thomsons Lake | 86 | 431 | 7.85 | 105 | Moderately hard |
| Hamilton Hill | 79 | 405 | 8.00 | 100 | Moderately hard |
| Armadale/Kelmscott | 77 | 391 | 7.83 | 96 | Moderately hard |
| Greenmount/Darlington | 73 | 378 | 7.91 | 88 | Moderately hard |
| Mt Eliza | 69 | 444 | 7.82 | 118 | Moderately hard |
| Buckland Hill | 63 | 396 | 7.81 | 103 | Moderately hard |
| Bold Park | 62 | 286 | 7.78 | 68 | Moderately hard |
| Pinjarra | 60 | 154 | 8.07 | 23 | Soft |
| Mandurah | 54 | 147 | 8.47 | 22 | Soft |
| Melville | 54 | 356 | 7.79 | 94 | Soft |
| Tamworth Hill | 53 | 139 | 8.23 | 20 | Soft |
| Hills Direct | 46 | 183 | 7.46 | 40 | Soft |
| North Dandalup | 33 | 155 | 6.96 | 38 | Soft |
| Dwellingup | 29 | 142 | 7.02 | 35 | Soft |
Perth-wide average: 96 mg/L. Moderately hard.
The split: 3 very hard, 3 hard, 15 moderately hard, 7 soft. Over half of Perth’s localities sit in the moderately hard range, which is where most residents notice some scale buildup but nothing severe.
Which Suburbs Have the Hardest and Softest Water?
Each locality covers multiple suburbs. Here’s how Perth’s water hardness maps to the areas you know.
Hardest water in Perth (120–228 mg/L):
| Suburb Area | Locality | Hardness (mg/L) |
|---|---|---|
| Two Rocks, Yanchep, Alkimos | Two Rocks / Yanchep / Neerabup | 190–228 |
| Ellenbrook, The Vines, Upper Swan | Lexia | 145 |
| Mirrabooka, Balga, Nollamara, Westminster | Mirrabooka | 128 |
| Wanneroo, Landsdale, Madeley | Wanneroo | 124 |
| Whitfords, Hillarys, Sorrento, Duncraig | Whitfords | 120 |
Softest water in Perth (29–60 mg/L):
| Suburb Area | Locality | Hardness (mg/L) |
|---|---|---|
| Dwellingup | Dwellingup | 29 |
| North Dandalup | North Dandalup | 33 |
| Mundijong, Byford (partial) | Hills Direct | 46 |
| Waikiki, Baldivis (partial) | Tamworth Hill | 53 |
| Mandurah, Greenfields, Halls Head | Mandurah | 54 |
| Melville, Willagee, Palmyra | Melville | 54 |
The geographic pattern is straightforward. Head north from the CBD and hardness increases steadily. Head south or into the Darling Range hills and it drops. If you live between Perth CBD and Joondalup, expect moderately hard water around 80–130 mg/L. If you live on Perth’s northern fringe at Yanchep or Two Rocks, your water is among the hardest in the country.
Not sure which locality covers your address? Check your suburb on WaterScore’s Perth page for exact readings.
Why Perth’s Water Is So Hard
Perth’s water hardness story starts underground. Nearly half of the city’s supply comes from two major aquifer systems.
The Gnangara Mound stretches north of the Swan River across about 2,200 km² of Perth’s northern suburbs. Water filters through layers of sand, sandstone, and limestone over decades. The limestone is the key factor. As groundwater moves through it, calcium and magnesium carbonates dissolve into the water. The longer the contact time, the harder the water. Northern localities like Two Rocks and Yanchep draw from bores with extensive limestone contact, which is why their hardness exceeds 200 mg/L.
The Jandakot Mound sits south of the Swan River across the southern suburbs. It’s a smaller aquifer with less limestone, producing slightly softer groundwater.
Three aquifer layers underlie Perth: the Superficial (shallowest, sandy and limestone), the Leederville (confined, several hundred metres deep), and the Yarragadee (deepest and oldest). Bores draw from different layers depending on the locality, and each layer has a different mineral profile.
Desalination changes the equation. Perth’s two reverse osmosis plants at Kwinana and Binningup produce very soft water, close to zero hardness before remineralisation. After minimal mineral addition for stability, it’s blended into the network. Localities receiving a higher share of desalinated water, like Tamworth Hill (53 mg/L, TDS just 139), have dramatically lower hardness than groundwater-heavy localities like Neerabup (190 mg/L, TDS 584).
Surface water from the hills also tends to be soft. Darling Range dams like Mundaring Weir, Canning Dam, and South Dandalup collect rainfall that runs over granite and laterite, not limestone. Dwellingup (29 mg/L) and North Dandalup (33 mg/L) reflect this geology.
Perth’s third desalination plant at Alkimos is under construction and expected to deliver first water around 2028. As desalination’s share of supply grows, the city’s overall hardness should trend downward. But northern groundwater-fed suburbs will likely remain hard until the supply mix in those areas shifts.
How Perth Compares to Other Australian Cities
Perth sits among Australia’s harder capitals, but its extreme range makes simple comparisons misleading:
| City | Hardness Range (mg/L) | Average (mg/L) | Classification |
|---|---|---|---|
| Melbourne (metro) | 15 – 29 | 18 | Soft |
| Canberra | 37 – 39 | 38 | Soft |
| Sydney (metro) | 30 – 58 | 43 | Soft |
| Brisbane (SEQ) | 34 – 115 | 68 | Soft to moderately hard |
| Adelaide (metro) | 87 – 170 | 103 | Moderately hard to hard |
| Perth | 29 – 228 | 96 | Soft to very hard |
Perth’s average (96 mg/L) is close to Adelaide’s (103 mg/L), but the distribution is completely different. Adelaide’s hardness sits in a relatively narrow band (87–170 mg/L). Perth’s spread of 199 mg/L is the widest of any capital. Perth’s softest locality (Dwellingup, 29 mg/L) matches Melbourne. Its hardest (Two Rocks, 228 mg/L) is harder than any recorded suburb in any other capital city.
Perth is the only capital where localities exceed the 200 mg/L ADWG aesthetic guideline.
For a detailed comparison with Adelaide, see our Perth vs Adelaide water quality analysis.
What Hard Water Means for Your Home
The effects scale with the numbers. At 60 mg/L, you’ll barely notice. At 190 mg/L and above, it’s a daily factor.
Appliances and plumbing. In northern suburbs (190–228 mg/L), expect thick white limescale on kettle elements, showerheads, and tap aerators within weeks. Hot water systems lose efficiency as scale coats heating elements. In moderately hard inner suburbs (80–120 mg/L), scale builds slowly over months. In soft southern areas (29–60 mg/L), it’s minimal.
Soap and cleaning. Hard water reduces soap lather and leaves residue. In Two Rocks or Yanchep, you’ll use noticeably more shampoo, detergent, and dish soap than someone in Mandurah or Melville. Soap scum on shower screens builds quickly above 150 mg/L.
Skin and hair. Residents in Perth’s hardest suburbs sometimes notice drier skin, less manageable hair, and faster colour fade in dyed hair. The mineral residue left after washing can irritate sensitive skin or worsen eczema. Moving between Perth’s northern and southern suburbs often makes the difference obvious. Hard water can make hair feel coarse, but it has not been shown to cause hair loss; our hair loss guide explains why.
Hot water systems. Scale is the biggest long-term cost of hard water. In localities above 120 mg/L, annual flushing of your hot water system is recommended. Water Corporation advises releasing the pressure valve monthly in hard water areas. Tankless (instantaneous) systems are less affected since water doesn’t sit and deposit minerals.
Do You Need a Water Softener in Perth?
More so than any other Australian capital, the answer depends on where you live.
Very hard areas (180+ mg/L) – Two Rocks, Yanchep, Neerabup: A whole-house ion-exchange water softener is worth the investment. Expect to pay $1,500–$3,000 installed. It will extend the life of your hot water system, reduce cleaning time, and improve soap performance. A point-of-use reverse osmosis system ($200–$500) handles drinking water.
Hard areas (120–180 mg/L) – Lexia, Mirrabooka, Wanneroo: A water softener is beneficial but not essential. Regular descaling and liquid soaps reduce the most visible effects. An RO system for drinking water is a good option here.
Moderately hard areas (60–120 mg/L) – most inner Perth suburbs: You don’t need a softener. Quarterly descaling of your kettle and showerhead is enough. If chlorine taste is a concern, a carbon filter handles that.
Soft areas (under 60 mg/L) – Mandurah, Dwellingup, Tamworth Hill: No action needed for hardness. A carbon filter for chlorine taste is the only upgrade worth considering.
Standard carbon filters (benchtop or under-sink) remove chlorine taste but do not reduce hardness. For hardness reduction, you need an ion-exchange softener (whole-house) or a reverse osmosis system (point-of-use). See our reverse osmosis vs carbon filters comparison or best water filter for Perth for specific recommendations.
What You Can Do
-
Check your suburb’s water hardness. Look up your address on WaterScore’s Perth page for readings from your supply locality.
-
Use the water hardness calculator to convert between mg/L, ppm, German degrees, grains per gallon, and other hardness scales.
-
Test your own water. A TDS meter ($15–$30 from Bunnings) gives a quick read on total dissolved solids. For hardness specifically, use a liquid drop test kit or hardness test strips.
-
Choose the right filter for your area. Northern suburbs benefit from reverse osmosis or a water softener. Southern suburbs need only a carbon filter for taste. See our Perth filter recommendations. For ranked product picks, see our guide to the best water filters in Australia.
-
Descale appliances regularly. White vinegar works for kettles and showerheads. Monthly in hard areas, quarterly in moderately hard areas.
-
Contact Water Corporation on 13 13 75 to check your specific area’s water quality data.
-
Compare two suburbs side by side. The suburb comparison tool puts Perth suburbs next to each other, or against another city, on hardness, chlorine, fluoride and overall score.
Frequently Asked Questions
Is Perth water hard or soft?
It depends on your suburb. Perth water hardness ranges from 29 mg/L in Dwellingup (soft) to 228 mg/L in Two Rocks (very hard). Northern suburbs fed by Gnangara Mound groundwater are hardest. Southern areas and the hills are softest. The city-wide average is about 96 mg/L, classified as moderately hard.
What is the water hardness in Perth in mg/L?
Perth’s 28 supply localities range from 29 to 228 mg/L CaCO3. The average is 96 mg/L. Two localities exceed the ADWG 200 mg/L aesthetic guideline: Two Rocks at 228 mg/L and Yanchep at 204 mg/L. Most inner suburbs sit between 60 and 120 mg/L.
Which Perth suburbs have the hardest water?
The hardest water in Perth comes from northern localities supplied by Gnangara Mound groundwater. Two Rocks measures 228 mg/L, Yanchep 204 mg/L, and Neerabup 190 mg/L. Wanneroo, Mirrabooka, and Lexia are also hard at 124–145 mg/L.
Which Perth suburbs have the softest water?
The softest water comes from southern and hills localities. Dwellingup measures 29 mg/L, North Dandalup 33 mg/L, and Hills Direct 46 mg/L. These areas receive surface water from Darling Range dams with minimal limestone contact. Tamworth Hill (53 mg/L) benefits from desalinated supply.
Do I need a water softener in Perth?
It depends on your area. In northern suburbs like Two Rocks, Yanchep, and Neerabup where hardness exceeds 190 mg/L, a water softener reduces scale buildup significantly. For inner suburbs at 60–120 mg/L, regular descaling is usually enough. Southern suburbs under 60 mg/L don’t need one.
Why is Perth water so hard?
Perth’s hardness comes from groundwater drawn from the Gnangara Mound and Jandakot aquifers. These aquifers sit in limestone and sandstone formations that dissolve calcium and magnesium into the water. Northern suburbs have the most limestone contact. Perth’s desalination plants produce very soft water, and suburbs receiving more desalinated supply have lower hardness.
Summary
Water hardness in Perth ranges from 29 mg/L in the southern hills to 228 mg/L in the northern suburbs, with a city-wide average of 96 mg/L. That’s the widest spread of any Australian capital, driven by the interplay between mineral-rich groundwater from limestone aquifers, soft surface water from the Darling Range, and very soft desalinated supply. If you live in Perth’s northern corridor, your water is genuinely hard and a softener may be worthwhile. In the inner suburbs, regular descaling handles the moderate hardness. For your suburb’s specific readings, check WaterScore’s Perth water hardness page.
Sources
- Water Corporation. (2024). Drinking Water Quality Annual Report 2023-24 — Perth Aesthetic Data Tables. watercorporation.com.au
- Water Corporation. (2024). Drinking Water Quality Annual Report 2023-24. watercorporation.com.au
- Water Corporation. (2024). Perth’s Integrated Water Supply Scheme. watercorporation.com.au
- NHMRC & NRMMC. (2022). Australian Drinking Water Guidelines 6 — Hardness. nhmrc.gov.au
- Water Corporation. (2024). Groundwater. watercorporation.com.au
- Bureau of Meteorology. (2024). National Water Account 2024 — Perth. bom.gov.au
- WaterScore — Perth Water Quality Data
Recommended filters for this topic
Hand-picked Amazon products relevant to this article.

iSpring
RCC7AK 6-Stage Under-Sink RO (with Alkaline Re-min)
4.6 · 13,756 ratings on Amazon

Berkey
Travel Water Filter (2× Black Elements)
4.5 · 3,034 ratings on Amazon
Disclaimer: This article is for general informational purposes only and does not constitute medical advice, health recommendations, or professional guidance of any kind. Data referenced may not reflect current water conditions. For specific concerns about your drinking water, consult your local water utility, a licensed water testing laboratory, or a health professional. See our Terms of Use.
Cite
Cite this page
Free to quote and reuse with a credit to WaterScore and a link to this page. Journalists and researchers can find key figures and contacts on our press and data page.
WaterScore. (2026, March 27). Water Hardness in Perth: Suburb-by-Suburb Data. https://waterscore.com.au/articles/water-hardness-perth/
Written by

Water Infrastructure Analyst
Civil engineer and former SA Water/Melbourne Water analyst specialising in comparative water quality.
Reviewed by

Lead Water Quality Analyst
Environmental scientist and water quality researcher with a PhD from the University of Melbourne.
What You Can Do
Check the water quality in your area and find the right filter for your needs.
Sponsored Amazon link. Check Amazon for current price and availability.
Related Articles
Australia's Hardest Water Suburbs: Where Limescale Wins
Hardest water suburbs in Australia ranked with actual mg/L readings. See the 20 suburbs exceeding ADWG guidelines and what limescale means for your home.
Brisbane vs Melbourne Water Hardness Compared
Brisbane's water is over 4x harder than Melbourne's at 81 mg/L vs 18 mg/L. See zone-by-zone data, practical impacts and filter advice for both cities.
Does Australian Water Cause Hair Loss? City Data (2026)
Does Australian water cause hair loss? City data shows Melbourne and Sydney water is soft, and hard water studies used water four times harder than Perth's.