Water Hardness on the Sunshine Coast: Area-by-Area Data
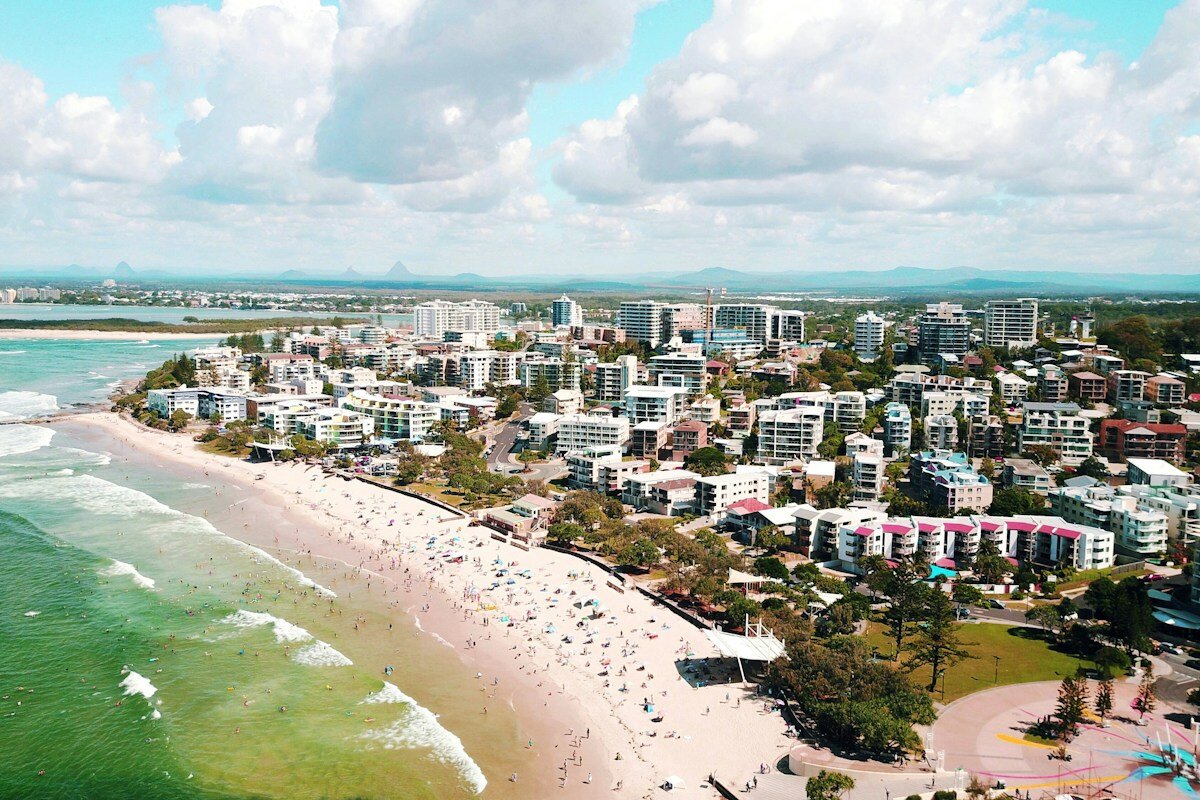
Water hardness on the Sunshine Coast sits almost exactly on the line between soft and moderately hard. Seqwater’s Sunshine Coast supply zone averaged 58.6 mg/L of hardness across 149 samples in the 12 months to August 2026, and Unitywater, which runs the pipes from Beerwah to Noosa, averaged 61 mg/L across 700 samples of its own. Both figures are under a third of the ADWG aesthetic guideline of 200 mg/L and about half of Brisbane’s 118 mg/L.
The coast is not one uniform supply, though. Four treatment plants feed it, and in August 2026 they ranged from 48 mg/L at Landers Shute, which serves Caloundra, Kawana and Maroochydore, to 88 mg/L at Image Flat, which serves Nambour, Bli Bli and Coolum. This guide maps each plant to the suburbs it supplies, explains why Sunshine Coast water hardness moves from month to month, compares the coast with the rest of South East Queensland, and covers what the numbers mean for kettles, dishwashers and softeners.
What Is Water Hardness?
Hardness measures the calcium and magnesium dissolved in water, reported as mg/L of calcium carbonate (CaCO3). Water picks the minerals up from rock and soil on its way to a dam, so hardness is mostly a story about where the water comes from.
| Classification | Hardness (mg/L CaCO3) |
|---|---|
| Soft | 0 – 60 |
| Moderately hard | 61 – 120 |
| Hard | 121 – 180 |
| Very hard | 181+ |
The 200 mg/L guideline exists to limit scale in pipes and hot water systems. It is not a health limit. The NHMRC’s hardness fact sheet uses broader bands, describing water under 60 mg/L as “soft but possibly corrosive” and 60 to 200 mg/L as “good quality”. The Sunshine Coast average sits right on that boundary. Our guide to hard water versus soft water covers the everyday differences.
Sunshine Coast Water Hardness: The Latest Data
Two organisations test the coast’s water. Seqwater treats it and publishes a monthly Bulk Drinking Water Quality Report for its Sunshine Coast zone. Unitywater, the retailer, reports on its own network sampling for what it calls the North region: every Sunshine Coast and Noosa council area on reticulated water except Kenilworth.
| Source | Period | Samples | Average (mg/L) | Range (mg/L) | Classification |
|---|---|---|---|---|---|
| Seqwater, Sunshine Coast zone | August 2026 | 13 | 61.5 | 42 – 88 | Moderately hard |
| Seqwater, Sunshine Coast zone | 12 months to August 2026 | 149 | 58.6 | 25 – 99 | Soft |
| Unitywater, North region | 2024-25 | 700 | 61 | 20 – 102 | Moderately hard |
Unitywater also publishes a 95th percentile of 83 mg/L, so only one sample in 20 came in harder than that. The hardest sample either utility recorded was still 98 mg/L below the guideline.
The split between the two minerals is where the coast differs from its neighbours.
| 12 months to August 2026 (Seqwater) | Sunshine Coast | Gold Coast | Brisbane |
|---|---|---|---|
| Calcium (mg/L) | 14.4 | 14.2 | 25.1 |
| Magnesium (mg/L) | 5.57 | 1.16 | 13.26 |
| Total hardness (mg/L CaCO3) | 58.6 | 39.5 | 118.0 |
The Sunshine Coast and the Gold Coast carry almost the same calcium. The gap between them is magnesium, at nearly five times the Gold Coast level. Converted to calcium carbonate, magnesium supplies about 39% of the coast’s hardness, against about 12% on the Gold Coast. As the plant data below shows, most of that magnesium comes from the northern dams and Noosa.
Other aesthetic readings sit well inside their guidelines. Total dissolved solids averaged 154 mg/L against a guideline of 600, sodium averaged 19.8 mg/L against 180, and field pH averaged 7.1.
Water Hardness by Treatment Plant
Seqwater’s zone figure blends samples from eight sites: the four main treatment plants, the small Kenilworth plant, and three points on the network. Seqwater also publishes each site’s results separately. Most sites are sampled for hardness once a month, so treat these as a snapshot, not a long-term average.
| Site (August 2026) | Raw water source | Hardness (mg/L) | Calcium (mg/L) | Magnesium (mg/L) |
|---|---|---|---|---|
| Landers Shute WTP | Baroon Pocket Dam | 48 | 14 | 3 |
| Ewen Maddock WTP | Ewen Maddock Dam | 74 | 27 | 2 |
| Image Flat WTP (2 samples) | Cooloolabin, Wappa and Poona dams | 88 | 16.5 | 11 |
| Noosa WTP | Lake Macdonald and the Mary River | 70 | 12 | 9 |
| Kenilworth WTP | Mary River bores | 85 | 17 | 10 |
| Caloundra St, Landsborough (5 samples) | Network monitoring point | 42 – 54 (avg 48) | 12.2 | 4.6 |
| Eudlo Pump Station | Network | 52 | 14 | 5 |
| Noosa Connection | Network | 55 | 13 | 5 |
Baroon Pocket Dam, which supplies most of the southern and central coast, produces the softest water. Image Flat, Noosa and Kenilworth carry 9 to 11 mg/L of magnesium, against 2 to 3 mg/L at the two southern plants, and that magnesium is what pushes them towards 70 to 90 mg/L. Ewen Maddock is the odd one out: harder than Landers Shute, but almost entirely through calcium.
Which Suburbs Get Which Water?
Unitywater publishes which plant normally supplies which part of the coast. Combining that with Seqwater’s plant results gives the closest thing to suburb-level Sunshine Coast water hardness that the published data allows.
| Area | Suburbs | Usual plant | August 2026 hardness |
|---|---|---|---|
| Southern and central coast | Caloundra, Pelican Waters, Kawana Waters, Mooloolaba, Maroochydore, Buderim, Sippy Downs | Landers Shute, with Ewen Maddock in the Caloundra area | 48 (Landers Shute), 74 (Ewen Maddock) |
| Maleny and the railway towns | Maleny, Beerwah, Landsborough, Glass House Mountains | Landers Shute | 48 |
| North coast and Nambour | Nambour, Coolum Beach, Bli Bli, Eumundi, Twin Waters, Mudjimba, Peregian Springs | Image Flat | 88 |
| Yandina | Yandina | Image Flat only (not on the grid) | 88 |
| Noosa | Noosa Heads, Tewantin, Noosaville, Cooroy, Pomona, Cooran | Noosa | 70 |
| Kenilworth | Kenilworth | Kenilworth (off-grid bores) | 85 |
Three caveats apply. The plants are joined to the grid, so any suburb except Yandina and Kenilworth can receive water from elsewhere on a given day. Unitywater names supply areas rather than suburbs for the southern coast and the railway towns, so we have placed suburbs in those rows by location, and suburbs on the edge of two areas may get a blend. And WaterScore’s suburb pages currently show the same zone-wide figure for every suburb, the 52.3 mg/L in Seqwater’s March 2026 report. On the plant data, that understates the north coast and Noosa, and sits close to the Landers Shute water most of the southern coast receives.
Homes on rainwater tanks or private bores sit outside these numbers entirely. Further south, Unitywater’s South region, from Caboolture to Redcliffe, averaged 66 mg/L in 2024-25 but peaked at 170 mg/L.
Why Sunshine Coast Water Hardness Moves From 25 to 99 mg/L
The plants differ. The four plants produced water from 48 to 88 mg/L in August 2026, so part of the zone’s 12-month range simply reflects which plant or network point a sample came from. Which plant supplies a given street can also change from week to week as Seqwater balances its sources.
The grid moves water both ways. The Northern Pipeline Interconnector links the Noosa plant to the North Pine plant north of Brisbane and can carry up to 65 megalitres a day in either direction. Unitywater says Sunshine Coast water can at times come from North Pine Dam. Between February 2025 and February 2026, Seqwater sent 2,055 megalitres into the Noosa zone through the pipeline from other grid sources, and moved 550 megalitres the other way.
Lake Macdonald is being rebuilt. Seqwater’s dam safety upgrade has lowered Lake Macdonald by about 2 metres from full supply level. The Noosa plant keeps operating at about 20 megalitres a day on average, but Seqwater’s compliance report says the drawdown has caused “short-term water quality variability” and that transfers along the pipeline may increase while the works continue. The works are scheduled to finish in 2029.
None of this changes the overall picture. The year’s hardest sample, 99 mg/L, is still moderately hard and half the guideline.
How the Sunshine Coast Compares
Seqwater publishes the same report for every zone on the SEQ grid, which allows a clean comparison over the same 12 months.
| SEQ supply zone | 12-month average (mg/L) | 12-month range | August 2026 average | Classification |
|---|---|---|---|---|
| Gold Coast | 39.5 | 21 – 140 | 38.7 | Soft |
| Moreton | 56.0 | 28 – 100 | 59.9 | Soft |
| Sunshine Coast | 58.6 | 25 – 99 | 61.5 | Soft to moderately hard |
| Redland | 68.1 | 12 – 120 | 69.4 | Moderately hard |
| Logan | 84.6 | 32 – 150 | 63.4 | Moderately hard |
| Brisbane | 118.0 | 60 – 160 | 112.9 | Moderately hard |
Against the capitals, the coast is softer than Perth (96 mg/L on average) and Adelaide (103 mg/L), and harder than Sydney (43 mg/L) and Melbourne (18 mg/L). A household moving up from Brisbane will see roughly half the scale. One moving from Melbourne may notice a faint film on the kettle for the first time.
What Sunshine Coast Water Hardness Means at Home
Kettles, showerheads and coffee machines. At about 60 mg/L, scale builds slowly. Expect a thin white film on a kettle element after a few months, a little sooner in Nambour or Coolum than in Maroochydore. A vinegar rinse two or three times a year keeps it clear. If you see heavy white flakes, our guide to white residue in the kettle explains the other causes. Espresso machines cope well with water in this range, since boiler scale builds just as slowly.
Dishwashers. Most dishwasher manuals ask for hardness in mmol/L or German degrees rather than mg/L. Here is the coast’s water in the units appliance makers use.
| Unit | 12-month average (58.6 mg/L) | Image Flat, August 2026 (88 mg/L) | Hardest 12-month sample (99 mg/L) |
|---|---|---|---|
| mmol/L | 0.59 | 0.88 | 0.99 |
| German degrees (°dH) | 3.3 | 4.9 | 5.5 |
| French degrees (°fH) | 5.9 | 8.8 | 9.9 |
| Clark degrees (°e) | 4.1 | 6.2 | 6.9 |
| Grains per US gallon | 3.4 | 5.1 | 5.8 |
A Bosch quick reference guide puts everything from 0 to 1.1 mmol/L into its lowest setting, H00, so every Sunshine Coast sample in the past year falls in the bottom band, including the northern suburbs. Unitywater’s advice for the coast is shorter: “Leave your water-using appliances on factory settings” and “You do not need to add salt to the water”. Our water hardness calculator converts any other reading.
Hot water systems and pipes. Scale is not what wears out hot water systems here, and annual flushing for scale is unnecessary. The NHMRC notes that soft water may be more corrosive to pipes, depending on pH, alkalinity and dissolved oxygen. Seqwater’s reports note that water with a naturally low pH is conditioned, most commonly by adding lime, and the coast’s field pH of 7.1 sits inside the guideline range of 6.5 to 8.5.
Taste. Hardness at this level has little taste. What people notice is chlorine, which averaged 0.97 mg/L across Unitywater’s northern network, and that is the flavour a carbon filter removes. Unitywater also notes that when Seqwater changes the direction of flow in the pipeline, some households notice a temporary earthy taste or smell.
Do You Need a Water Softener on the Sunshine Coast?
No. A whole-house softener swaps calcium and magnesium for sodium, and at about 60 mg/L there is little to swap. Even Image Flat’s 88 mg/L produces only light scale. You would spend $1,500 to $3,000 to treat water that already sits at the soft end of the scale, and add sodium to it in the process.
If you want to change anything about Sunshine Coast tap water, change the taste. A carbon jug or benchtop filter removes chlorine, and because the water is soft, cartridges last their full rated life. Our Coles water filter jug guide compares the supermarket options, our ranking of the best water filters in Australia covers under-sink systems, and the Maroochydore filter page matches a filter to the zone’s readings. Reverse osmosis is only worth it if you want fluoride or other dissolved substances removed, which is a separate decision from hardness. Our reverse osmosis vs carbon filters comparison sets out the trade-offs.
What You Can Do
-
Find your plant. Use the table above to see whether your suburb is normally on Landers Shute, Image Flat, Noosa or Ewen Maddock water, then open that plant’s latest results from the map on Seqwater’s water quality report page.
-
Look up your suburb. The Maroochydore, Nambour and Noosa Heads hardness pages show the reading WaterScore holds for the zone, and Unitywater’s postcode checker lists every parameter it tests for your region.
-
Set your dishwasher to its lowest hardness setting. At 0.59 mmol/L on average and 0.88 mmol/L at Image Flat, the whole coast sits in the softest band on typical appliance charts. Convert other readings with the water hardness calculator.
-
Skip the softener. Put the money towards a carbon filter if chlorine taste bothers you.
-
Test at home if you are on a tank. Hardness test strips are inexpensive and show within a minute whether rainwater or bore water is behaving differently from the town supply.
-
Compare two suburbs side by side. The suburb comparison tool can put Maroochydore against Southport, which shows the Sunshine Coast and Gold Coast difference in one table.
Frequently Asked Questions
Is Sunshine Coast water hard or soft?
Soft to moderately hard, and close to the line between the two. Seqwater’s Sunshine Coast zone averaged 58.6 mg/L over the 12 months to August 2026, just under the 60 mg/L soft threshold, and Unitywater’s own network sampling averaged 61 mg/L. Both are under a third of the ADWG aesthetic guideline of 200 mg/L. Northern suburbs supplied by the Image Flat plant run harder than Caloundra and the south.
What is the water hardness on the Sunshine Coast in mg/L?
Seqwater’s Sunshine Coast zone measured 42 to 88 mg/L in August 2026, averaging 61.5 mg/L, and 25 to 99 mg/L over the previous 12 months, averaging 58.6 mg/L. Unitywater’s North region recorded 20 to 102 mg/L across 700 samples in 2024-25, with an average of 61 mg/L and a 95th percentile of 83 mg/L.
Which Sunshine Coast suburbs have the hardest water?
The suburbs supplied by the Image Flat treatment plant, which Unitywater lists as Bli Bli, Eumundi, Nambour, Twin Waters, Mudjimba, Coolum, Peregian Springs and Yandina. Image Flat measured 88 mg/L in August 2026, against 48 mg/L at Landers Shute, which supplies Caloundra, Kawana, Maroochydore, Buderim and the hinterland railway towns. Even 88 mg/L is moderately hard and well under the 200 mg/L guideline.
Is Noosa water hard?
Only mildly. The Noosa treatment plant, which draws on Lake Macdonald and the Mary River, measured 70 mg/L in August 2026, in the moderately hard band but close to the 60 mg/L soft threshold. Noosa can also receive water from the rest of the grid through the Northern Pipeline Interconnector, and imports increased during the Lake Macdonald dam upgrade. See the Noosa Heads hardness page for the zone reading.
What dishwasher hardness setting should I use on the Sunshine Coast?
The lowest one. The coast’s 12-month average of 58.6 mg/L equals 0.59 mmol/L or 3.3 German degrees, and the hardest sample of the year was 0.99 mmol/L. Bosch’s chart puts 0 to 1.1 mmol/L in setting H00, and Unitywater advises leaving appliances on factory settings without adding salt.
Do I need a water softener on the Sunshine Coast?
No. At about 60 mg/L there is little calcium and magnesium to remove, and even the hardest plant at 88 mg/L produces only light scale. A softener would cost $1,500 to $3,000 and add sodium to water that does not need it. A carbon filter for chlorine taste is the more useful purchase.
Summary
Water hardness on the Sunshine Coast averages about 60 mg/L, on the line between soft and moderately hard, and no sample from either utility in the latest reporting years topped 102 mg/L. Within that, Landers Shute water, which supplies most of the southern and central coast, runs softest at about 48 mg/L, while Image Flat water in Nambour and Coolum runs hardest at about 88. Whichever plant supplies your street, Sunshine Coast water hardness calls for the same response: set the dishwasher to its softest setting, descale the kettle a few times a year, and spend any filter money on chlorine taste rather than a softener.
Sources
- Seqwater, Monthly Performance and Long-term Performance (12 month), Sunshine Coast zone, August 2026, Seqwater, Brisbane, 2026. seqwater.com.au
- Seqwater, Site performance reports, August 2026: Landers Shute WTP, Ewen Maddock WTP, Image Flat WTP, Noosa WTP, Kenilworth WTP, Eudlo Pump Station, Caloundra St (Landsborough) and Noosa Connection, Seqwater, Brisbane, 2026. seqwater.com.au
- Seqwater, Monthly and 12-month performance reports for the Brisbane, Gold Coast, Logan, Moreton and Redland zones, August 2026, Seqwater, Brisbane, 2026. seqwater.com.au
- Unitywater, Drinking Water Service Annual Report 2024-2025, Unitywater, 2025. unitywater.com
- Unitywater, Where our water comes from and What’s in your water, Unitywater, 2026. unitywater.com
- Seqwater, Northern Pipeline Interconnector 2 (NPI2) Annual Compliance Report, 15 February 2025 to 15 February 2026, Seqwater, 2026. seqwater.com.au
- Seqwater, Lake Macdonald Dam Improvement Project, Seqwater, 2026. seqwater.com.au
- National Health and Medical Research Council, Australian Drinking Water Guidelines: Hardness (as calcium carbonate), NHMRC, Canberra. nhmrc.gov.au
- Bosch, Quick reference guide SMS46NI20Q (water hardness settings), BSH Hausgeräte, 2025. bosch-home.com
Recommended filters for this topic
Hand-picked Amazon products relevant to this article.

iSpring
RCC7AK 6-Stage Under-Sink RO (with Alkaline Re-min)
4.6 · 13,756 ratings on Amazon

Berkey
Royal 3.25 Gal (with Fluoride Filters)
4.5 · 1,628 ratings on Amazon
Disclaimer: This article is for general informational purposes only and does not constitute medical advice, health recommendations, or professional guidance of any kind. Data referenced may not reflect current water conditions. For specific concerns about your drinking water, consult your local water utility, a licensed water testing laboratory, or a health professional. See our Terms of Use.
Written by

Water Infrastructure Analyst
Civil engineer and former SA Water/Melbourne Water analyst specialising in comparative water quality.
Reviewed by

Lead Water Quality Analyst
Environmental scientist and water quality researcher with a PhD from the University of Melbourne.
What You Can Do
Check the water quality in your area and find the right filter for your needs.
Sponsored Amazon link. Check Amazon for current price and availability.
Related Articles
Does Brisbane Have Hard Water?
Yes — Brisbane has moderately hard water, ranging from 53 to 115 mg/L depending on your suburb. See how hardness varies by zone and what it means for your home.
Water Hardness on the Gold Coast: Suburb-by-Suburb Data
Gold Coast water hardness is soft at 35 to 45 mg/L across 124 suburbs, rising to 66 to 90 mg/L in the Logan-fed north. See every zone, why it is soft, and what it means at home.
Water Hardness in Brisbane: Suburb-by-Suburb Data
Brisbane water hardness ranges from 53 to 115 mg/L across supply zones. Check suburb-by-suburb data for every area in Greater Brisbane and South East QLD.